
![]()

IPython-Dashboard
A stand alone, light-weight web server for building, sharing graphs created in ipython. Build for data science, data analysis guys. Building an interactive visualization, collaborated dashboard, and real-time streaming graph.
Requirements
- redis 2.6+, install guide
- pip install -r requirements.txt
Goal
- support raw html visualization
- support python object visualization
- Editable
- Real-time fresh when rendering a variable python object
- Can be shared, both public and private [ need password ]
- In the notebook, can share an object to a dashboard [ that’s visualize that object in that dashboard ]
Use Case
- if you do exploring in notebook, but just want to share/send the result/summary to people, leave out the details.
- if you have a private notebook, but also need share something in that notebook with people, extract and put into another new notebook is ugly.
- if you are totally disappointed with the complicated code when drawing a graceful/staic graph using matplotlib/seaborn/mpld3 etc.
- if you want an interactive graph, allow people to zoom in/out, resize, get hover tips, change graph type easily.
- if you want a real-time graph.
- if you want an collaborated graph/dashboard.

Usage
*IPython-Dashboard-Tutorial.ipynb*: On nbviewer or On github
Run tests
just run sudo nosetests --with-coverage --cover-package=dashboard
under this repo
aaron@aarons-MacBook-Pro:~/Desktop/github/IPython-Dashboard$sudo nosetests --with-coverage --cover-package=dashboard
...
Name                                    Stmts   Miss  Cover   Missing
---------------------------------------------------------------------
dashboard.py                                9      0   100%
dashboard/client.py                         1      0   100%
dashboard/client/sender.py                 11      9    18%   22-34
dashboard/config.py                        12      0   100%
dashboard/server.py                         1      0   100%
dashboard/server/resources.py               0      0   100%
dashboard/server/resources/dash.py         41     25    39%   25-30, 39, 48-49, 55-71, 76-87
dashboard/server/resources/home.py          8      1    88%   20
dashboard/server/resources/storage.py      15      7    53%   20-22, 30-34
dashboard/server/utils.py                  31      6    81%   18-22, 29, 43
dashboard/server/views.py                  12      0   100%
---------------------------------------------------------------------
TOTAL                                     141     48    66%
----------------------------------------------------------------------
Ran 3 tests in 0.345s

OK
Change Log
- future
- import dashboard to ipython notebook, one click [ though I don’t think it’s necessary]
- front side, databricks style
- pep 8, code clean up & restructure
- hover tips
- edit modal can be resized
- Share one graph
- Share one dashboard
- Presentation mode
- slogan
- footer
- readthedoc
- unified message display center
- SQL Editor
- login management
- unified logger and exception report
- *V 0.1.3 : basic-curd-docs : [ current develop version ]*
- Dashboard
- restructure code for future develop
- more docs and tutorial
- basic curd operations
- gh-pages done
- publish on readthedoc
- hover tips
- SQL Editor
- start try using ace to build an online sql editor, but will develop it in the next stage after this version
- Dashboard
- *V 0.1.2 : visualiza-table : [ current stable release ]*
- slogan: *Inspired by IPython, built with love*
- Dashboard
- document and doc string
- usage
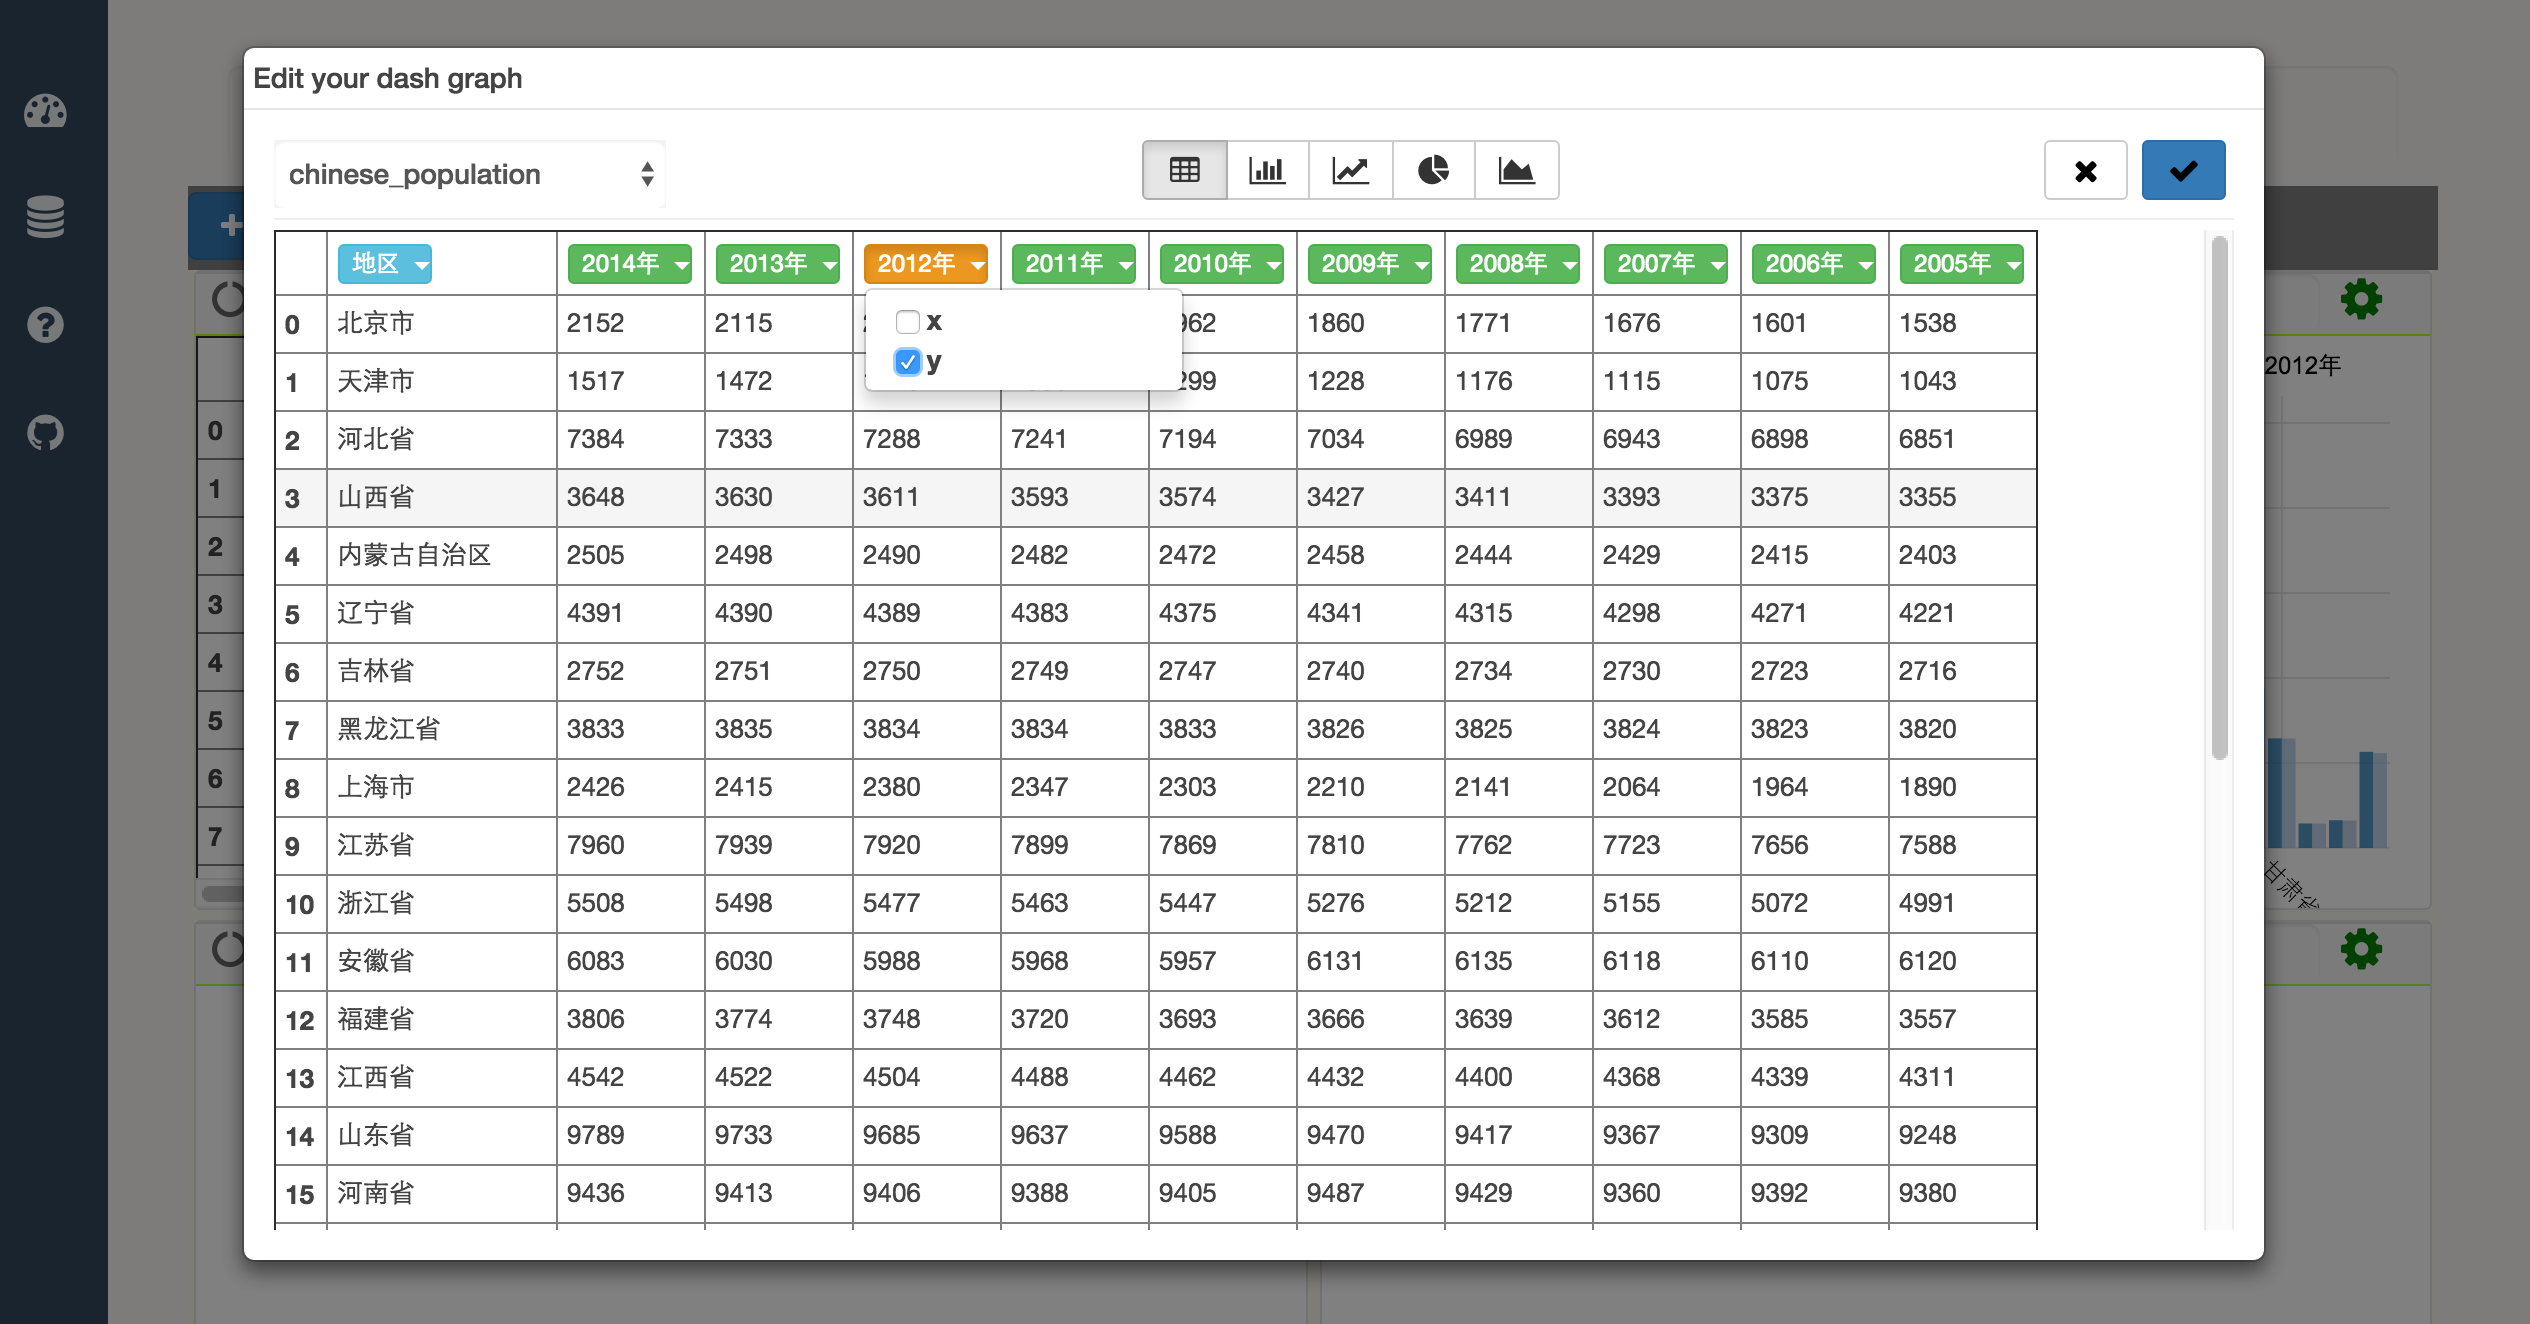
- simple visualize table data
- SQL Editor
- research & preparation
- V 0.1.1 : dashboard-server : [ current stable release ]
- Dashboard
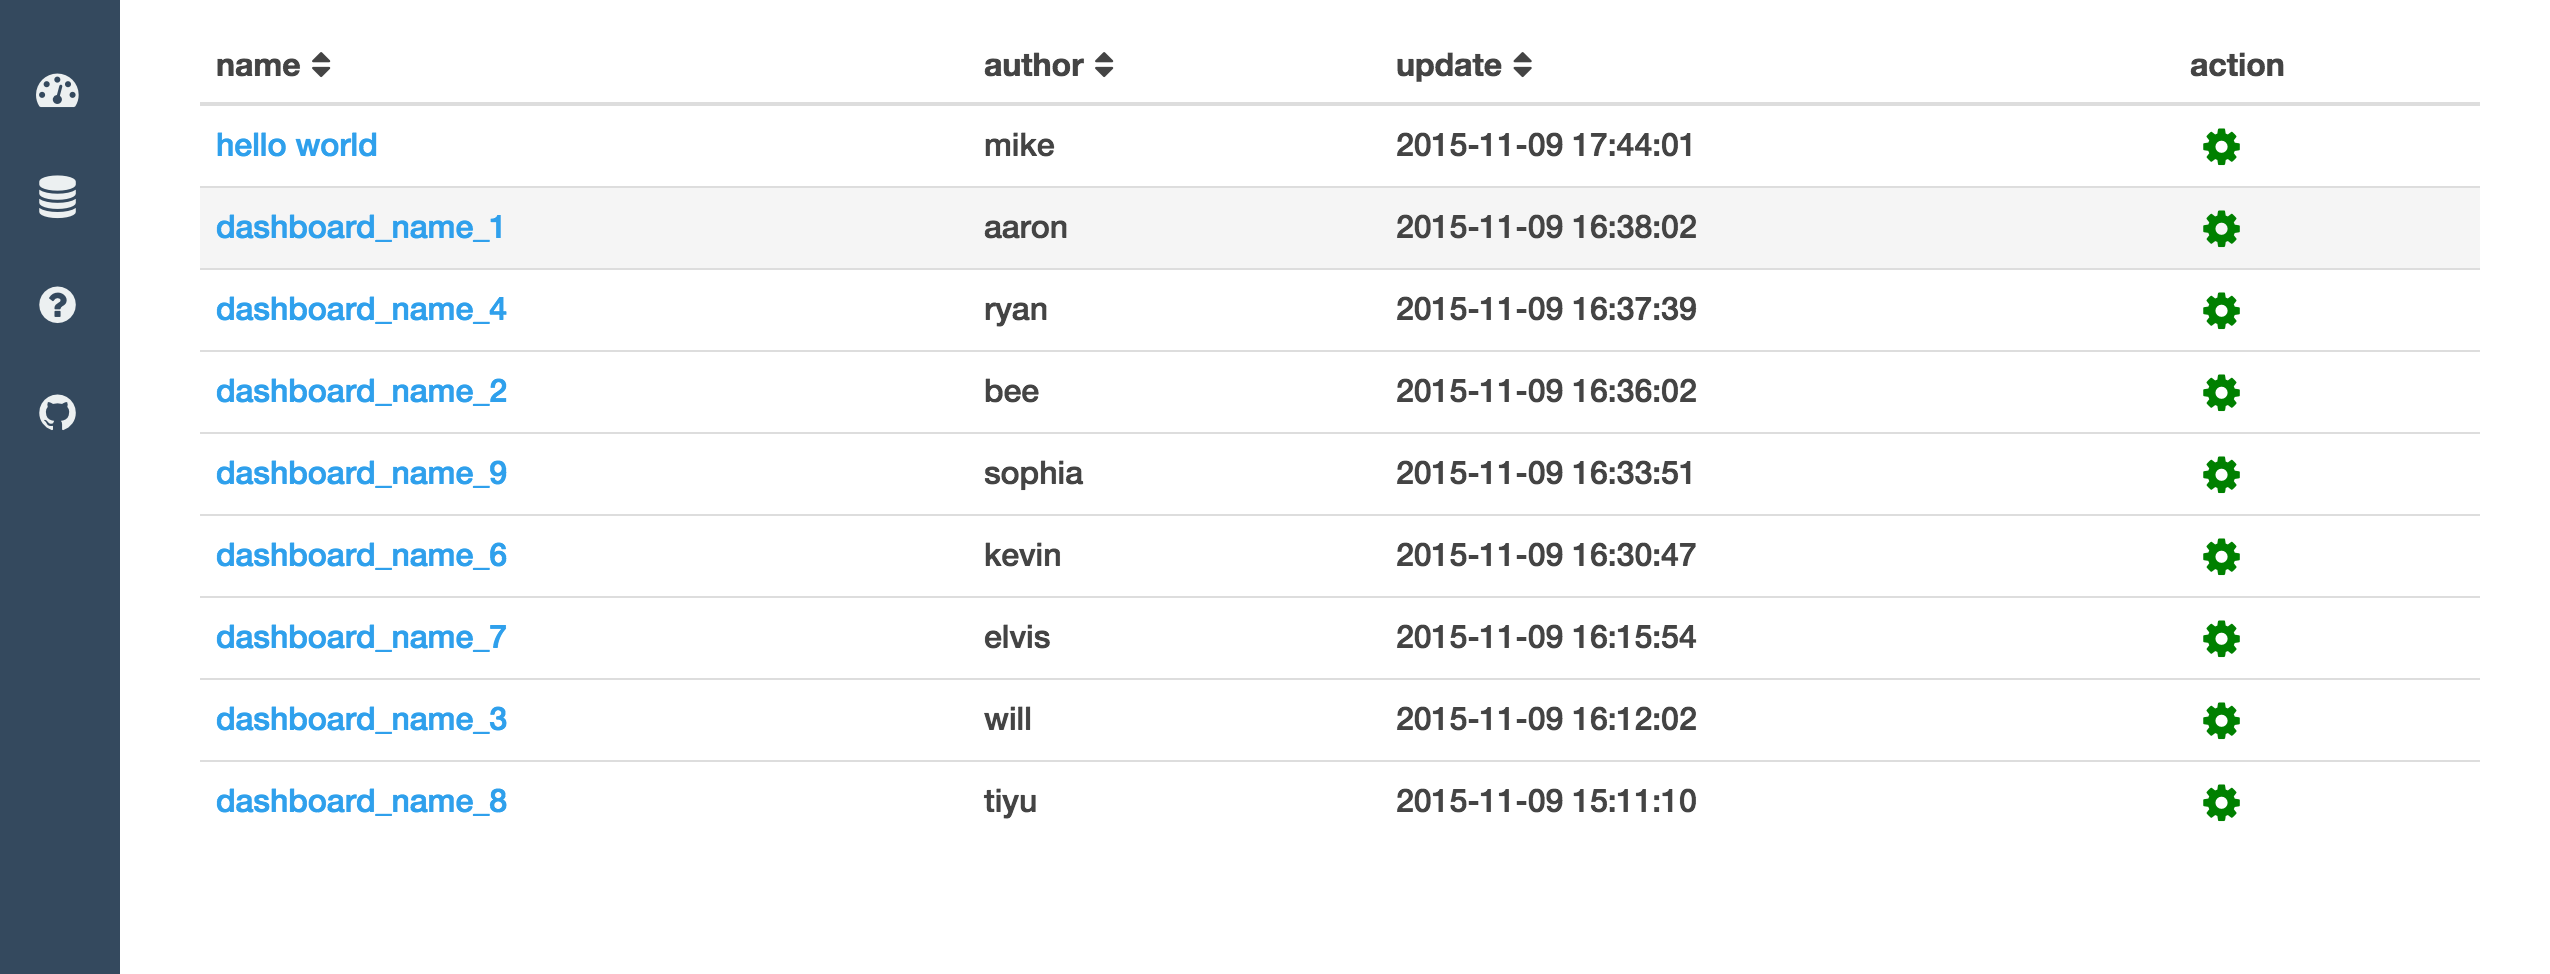
- dashboard home page
- sort by dashboard name / creator / last update time
- dashboard page
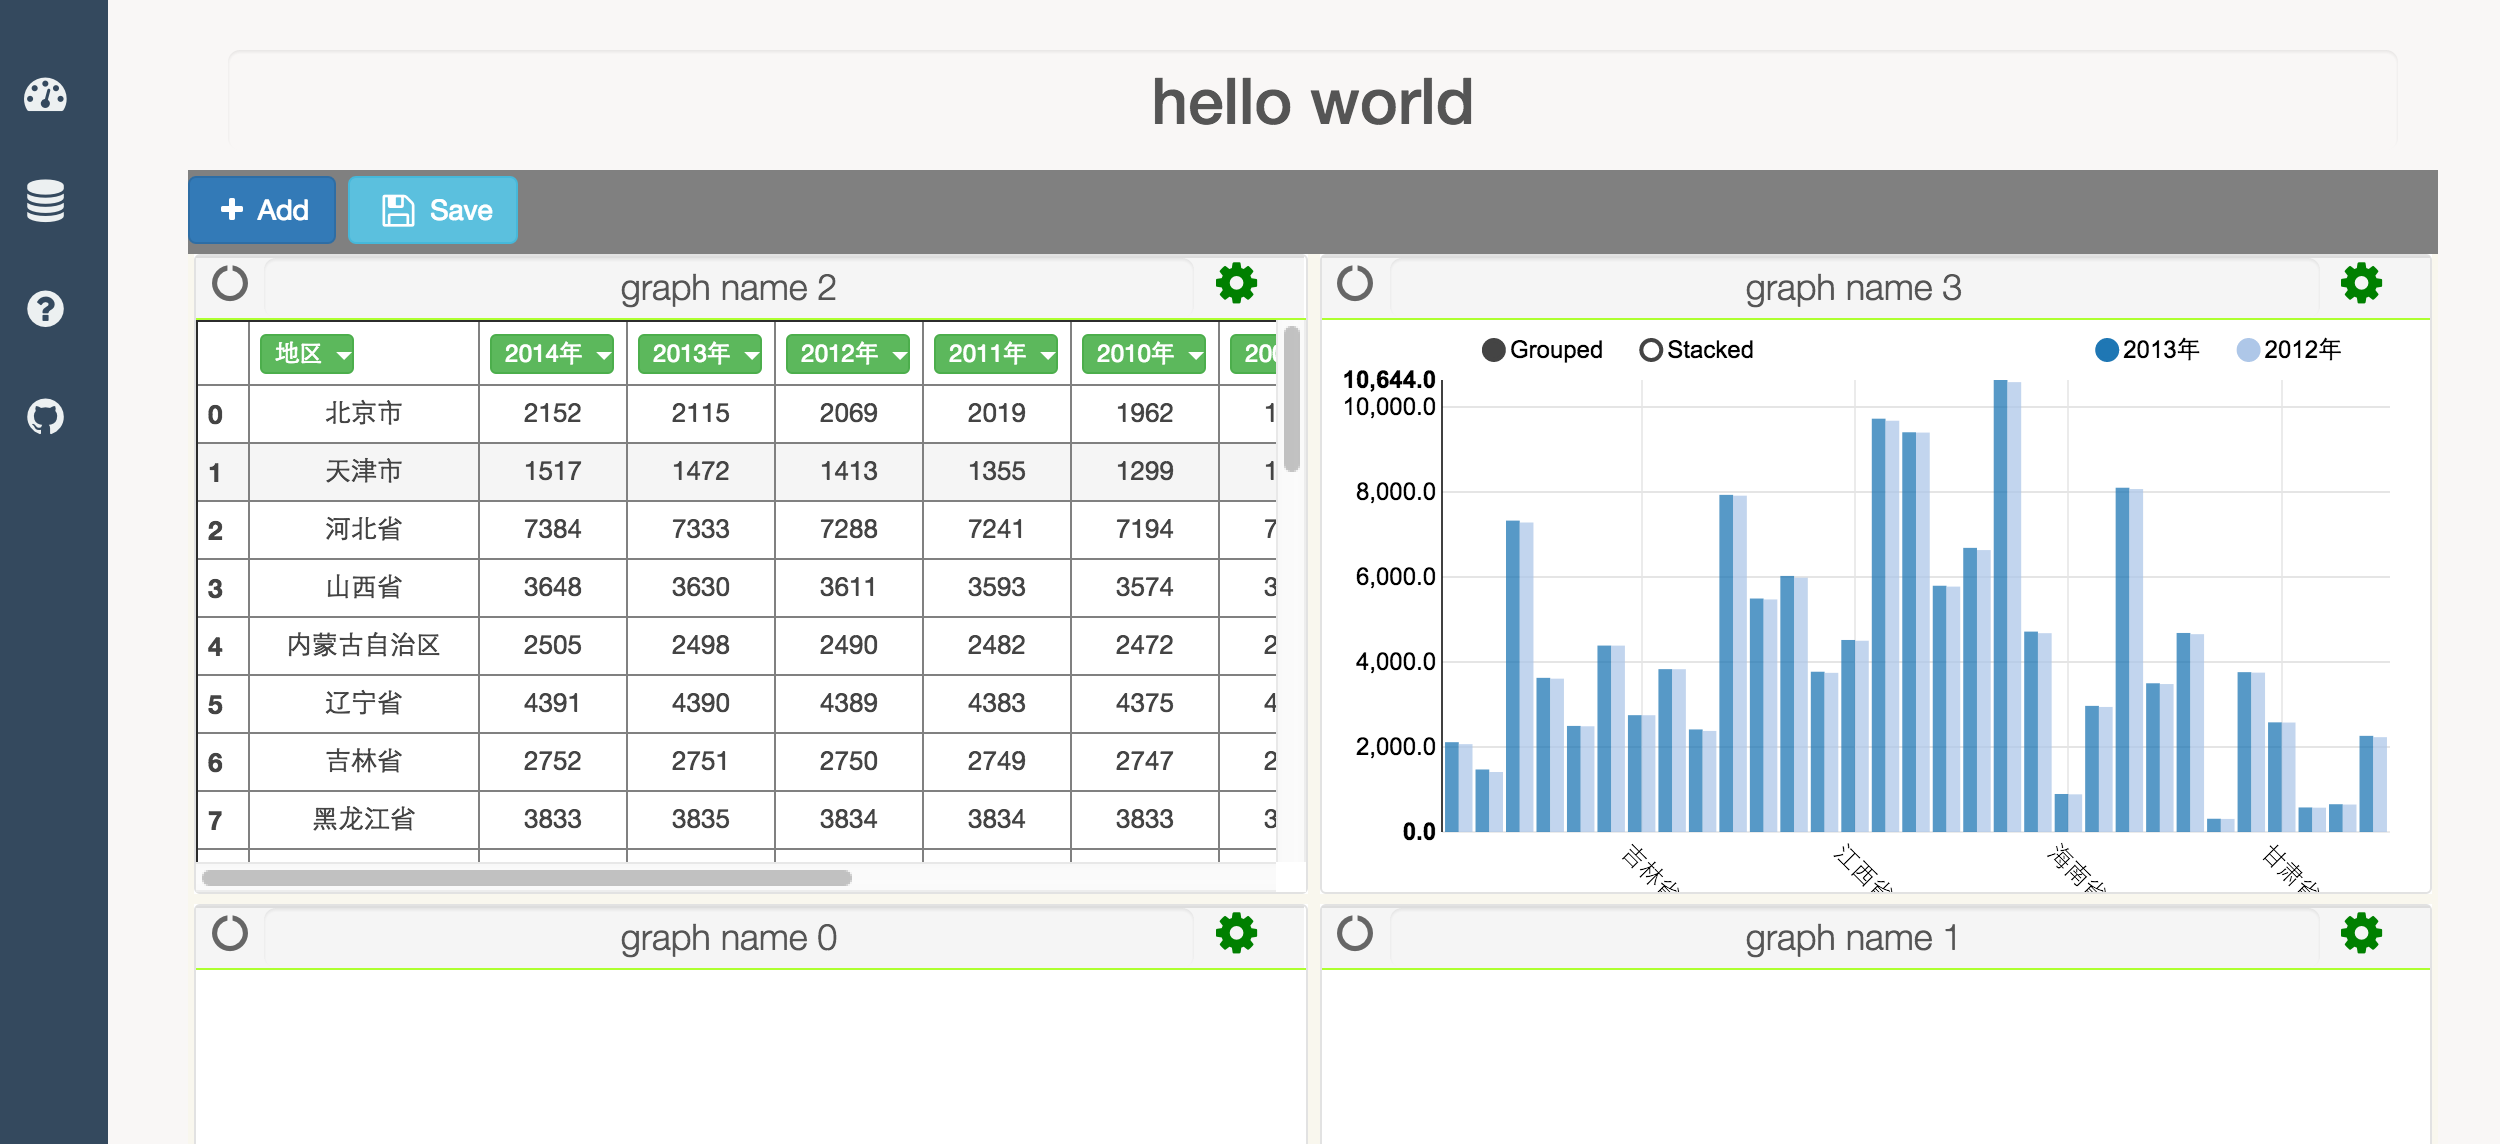
- add graph in a dashboard
- re-arrange graph
- resize graph
- get table view in a graph
- dashboard home page
- SQL Editor
- Dashboard
- V 0.1 : dashboard-template
- Add dashboard client template
- Template consists of box, each box is an independent front-side object
- Template hierarchy:
- box page [add, delete, share one or all]
- box graph [add, delete, share one or all]
- rename